
Senior HR Leader · HR Operations · Reporting & Automation
Human-centered HR leadership, translated into measurable business impact.
I bring senior-level HR judgment across commercial and government-contracting environments, then strengthen the work with clear reporting, executive communication, and practical Microsoft 365 automation.
decisions
How I work
Reliable data. Clearer people decisions.
Employee experience and operational accuracy are connected. Clean records, dependable controls, and clear reporting give HR teams more time and stronger evidence to support employees.
Before interpreting a workforce pattern, I check whether the underlying records and measure definitions support the comparison.
Case studies
Five questions, answered with evidence.
Each case starts with a question a leader would ask, shows how the data was checked, and ends with what to do next. Independent projects use fictional or publicly available sample data; nothing is client-confidential.
- 7 of 21records flagged for review Case 01 · Data controlsHRIS-to-Payroll ReconciliationWhich differences between the HRIS export and the payroll register need review before approval?ExcelPower Query
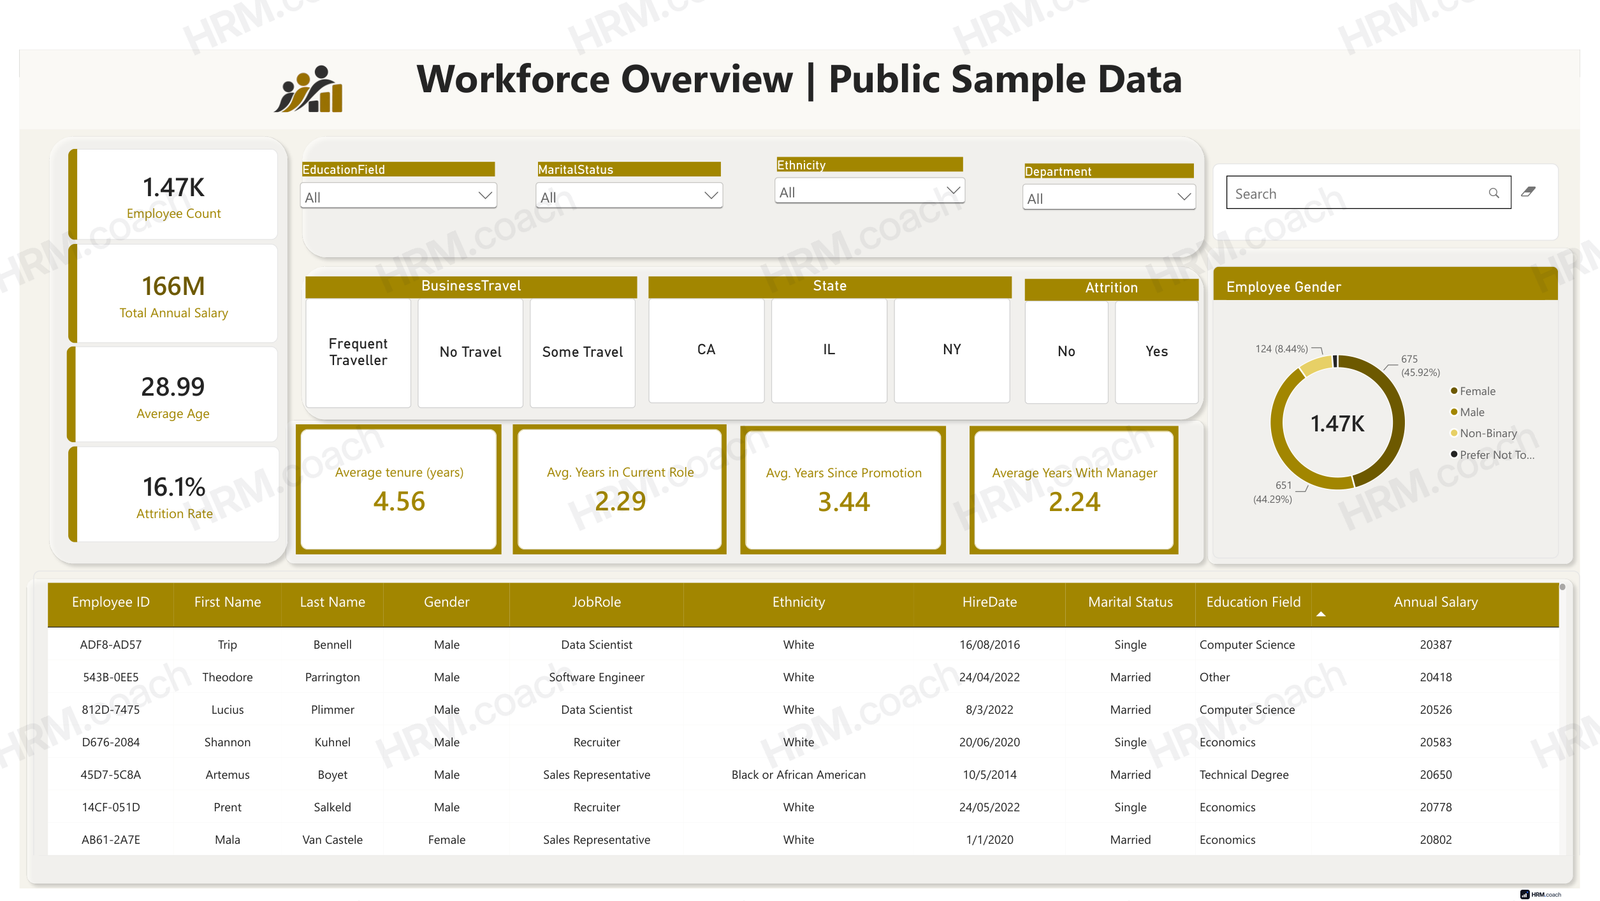
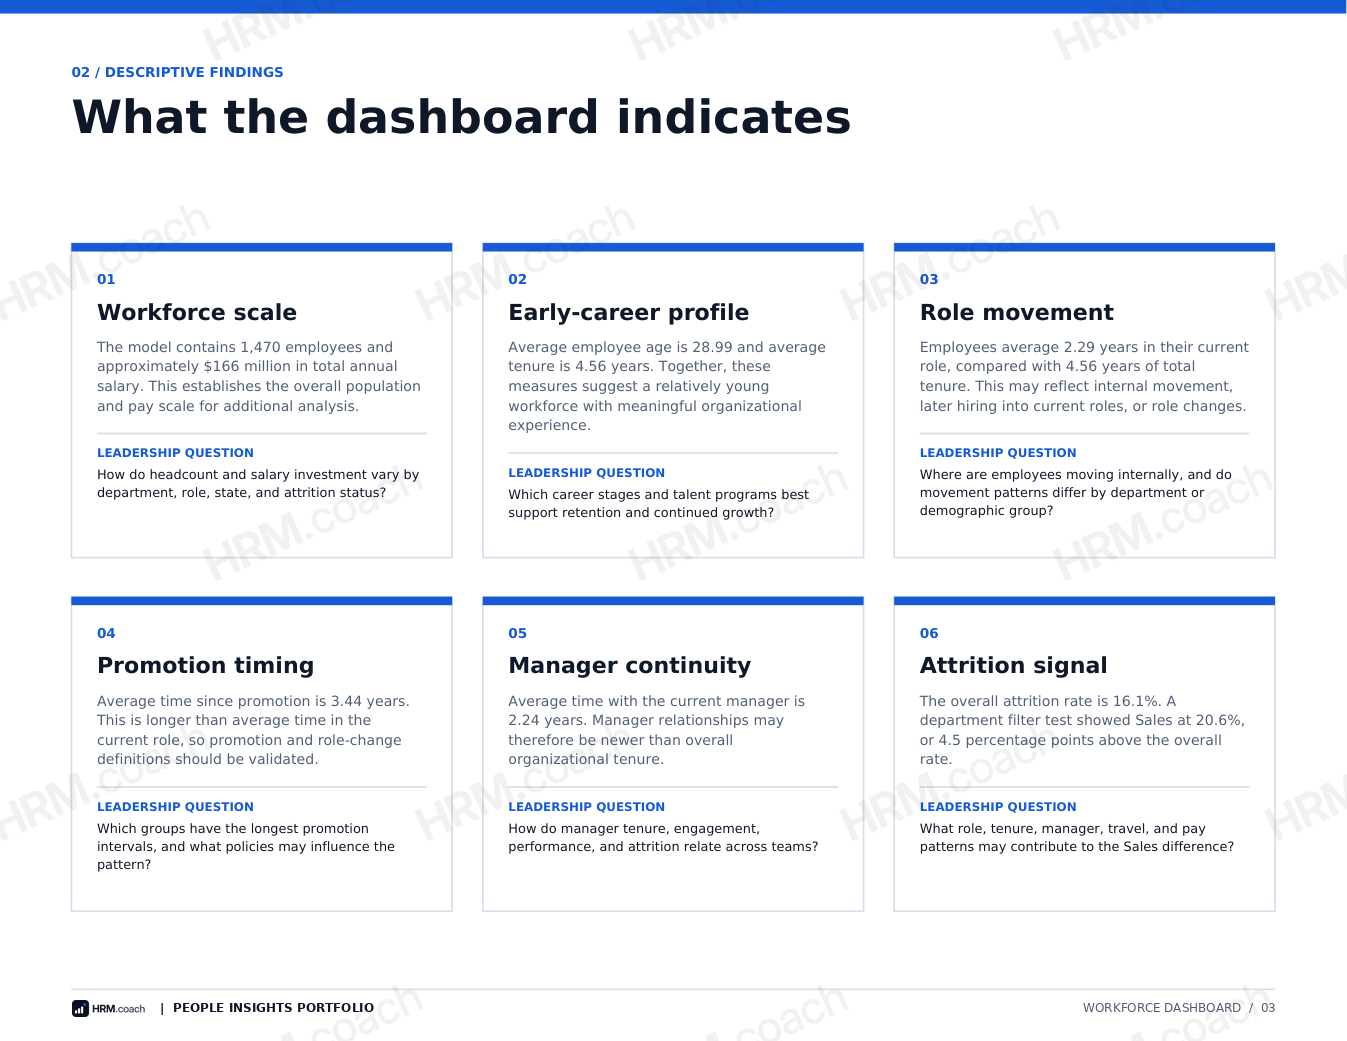
- 20.6%Sales attrition vs 16.1% overall Case 02 · Workforce insightWorkforce Metrics DashboardWhat do the core workforce measures show, and which questions should leaders ask next?Power BIDAX
- 20 / 20records pass after a controlled retest Case 03 · Data controlsEmployee Data Quality ReviewDoes the review actually catch a problem when one is introduced?ExcelPower Query
- 48% → 26%one-year turnover, before vs after Case 04 · Workforce insightNew-Hire Onboarding and RetentionWhere does the new-hire experience need stronger support?Power BIDAXPower Query
- 48.3%Customer Support attrition vs 20.1% overall Case 05 · Workforce insightWorkforce Attrition AnalysisWhich teams are losing people fastest, how early do they leave, and why?SQL
Case 01 · Data controls
HRIS-to-Payroll Reconciliation
Which differences between the HRIS export and the payroll register need review before approval?
- Data
- 21 fictional employee records from an HRIS export and a payroll register
- Method
- Full outer join on Employee ID, then status, pay and deduction rules
- Tools
- Excel, Power Query
- Result
- 7 of 21 records flagged for review
Completed project · Fictional demonstration data
A repeatable Power Query control that converts two workforce exports into a payroll exception report for review.
What needs attention
Two employees are missing from Payroll and one Payroll record is missing from HRIS. Three records have differences in salary, hourly rate, or benefit deductions. One employment-status difference needs validation: an active Payroll record for a terminated employee may reflect an authorized final or other post-termination payment.
Exception report
| Employee | Exception | HRIS | Payroll | Priority | Recommended review |
|---|---|---|---|---|---|
| E2002 | Salary mismatch | $92,000 | $94,500 | High | Confirm approved salary and effective date; correct the inaccurate source. |
| E2006 | Status mismatch | Terminated | Active | High | Confirm the termination date and whether Payroll remains active for an authorized final, out-of-cycle, or other post-termination payment. If no payment remains due, update Payroll status; otherwise document the reason and expected deactivation date. |
| E2009 | Hourly-rate mismatch | $24.50 | $25.25 | High | Confirm approved rate and effective date; assess retroactive-pay implications. |
| E2012 | Benefit deduction mismatch | $175 | $160 | Medium | Confirm election and deduction schedule; determine whether an adjustment is required. |
| E2015 | Missing from Payroll | Present | Missing | High | Confirm payroll eligibility and inclusion in the current register. |
| E2020 | Missing from Payroll | Present | Missing | High | Confirm payroll eligibility and inclusion in the current register. |
| E2098 | Missing from HRIS | Missing | Present | High | Validate worker identity and authorization; correct HRIS before approval. |
Recommended action
Validate all seven exceptions with HRIS and Payroll owners, document each resolution, correct the appropriate source system, and refresh the reconciliation and exception queries after checking the source paths, before final approval.
How the control works
- Import the HRIS and Payroll exports into Power Query.
- Trim, clean, and uppercase Employee IDs; assign appropriate data types.
- Use a Full Outer join on EmployeeID to retain records from either system.
- Check record presence, employment status, pay basis, salary, hourly rate, deductions, and compensation completeness.
- Assign Pass or Exception and create a unified reconciliation EmployeeID.
- Filter the reconciliation to exceptions for action owners.
- Update the source paths for the next period and refresh the affected queries.
What this demonstrates
HR judgment in defining review rules, a repeatable reporting control, traceability to source values, and clear recommendations for leaders.
Independent portfolio demonstration using fictional data. No client-confidential or real employee-identifiable information is included.
Case 02 · Workforce insight
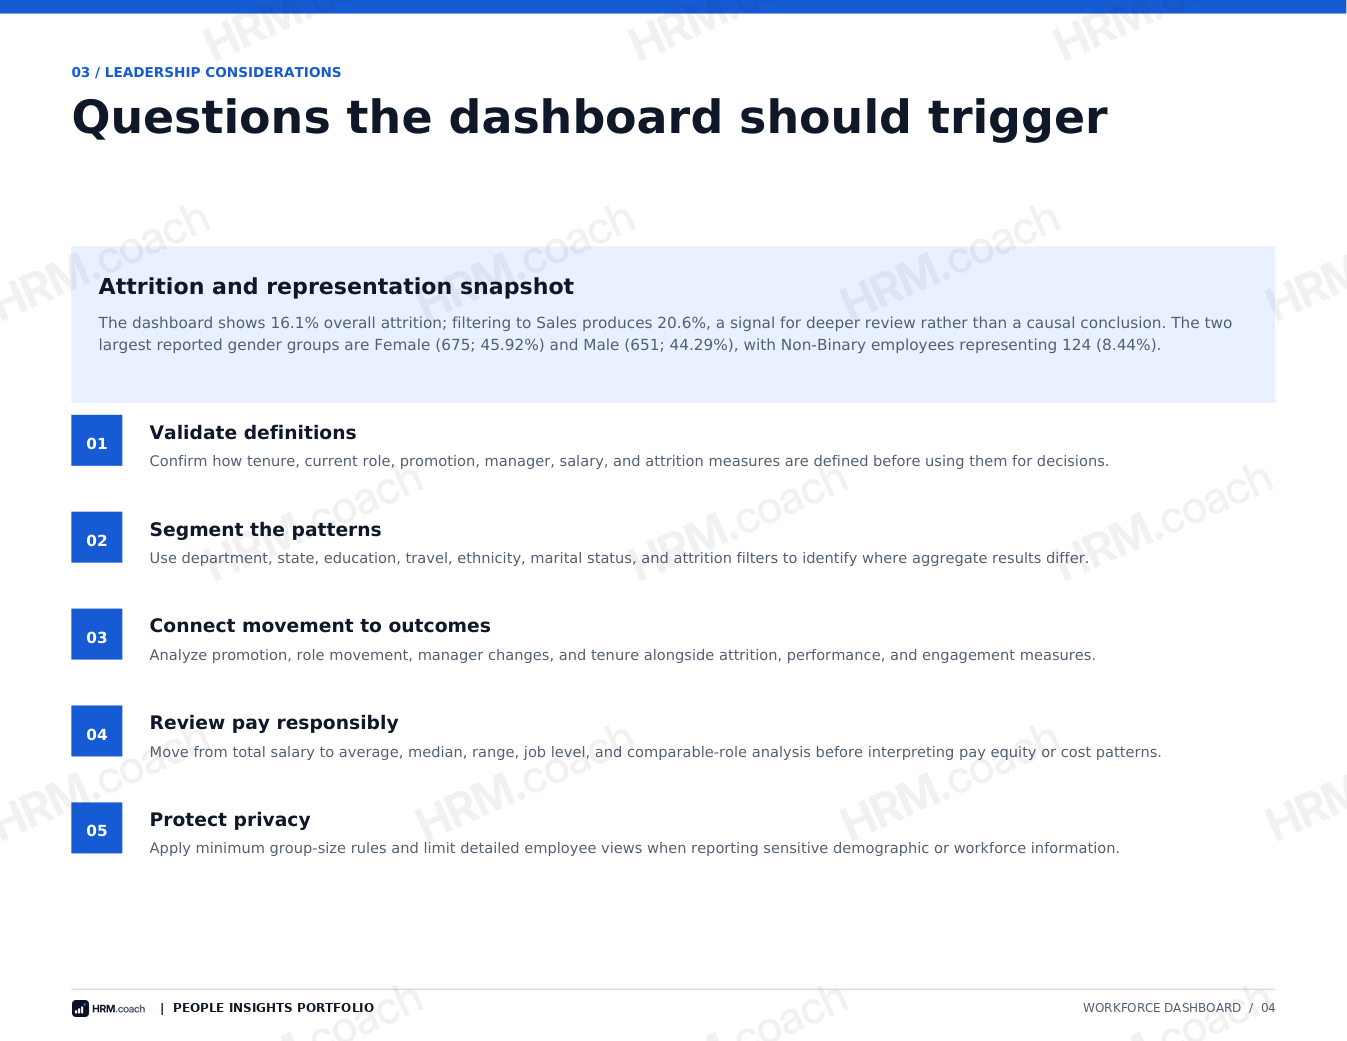
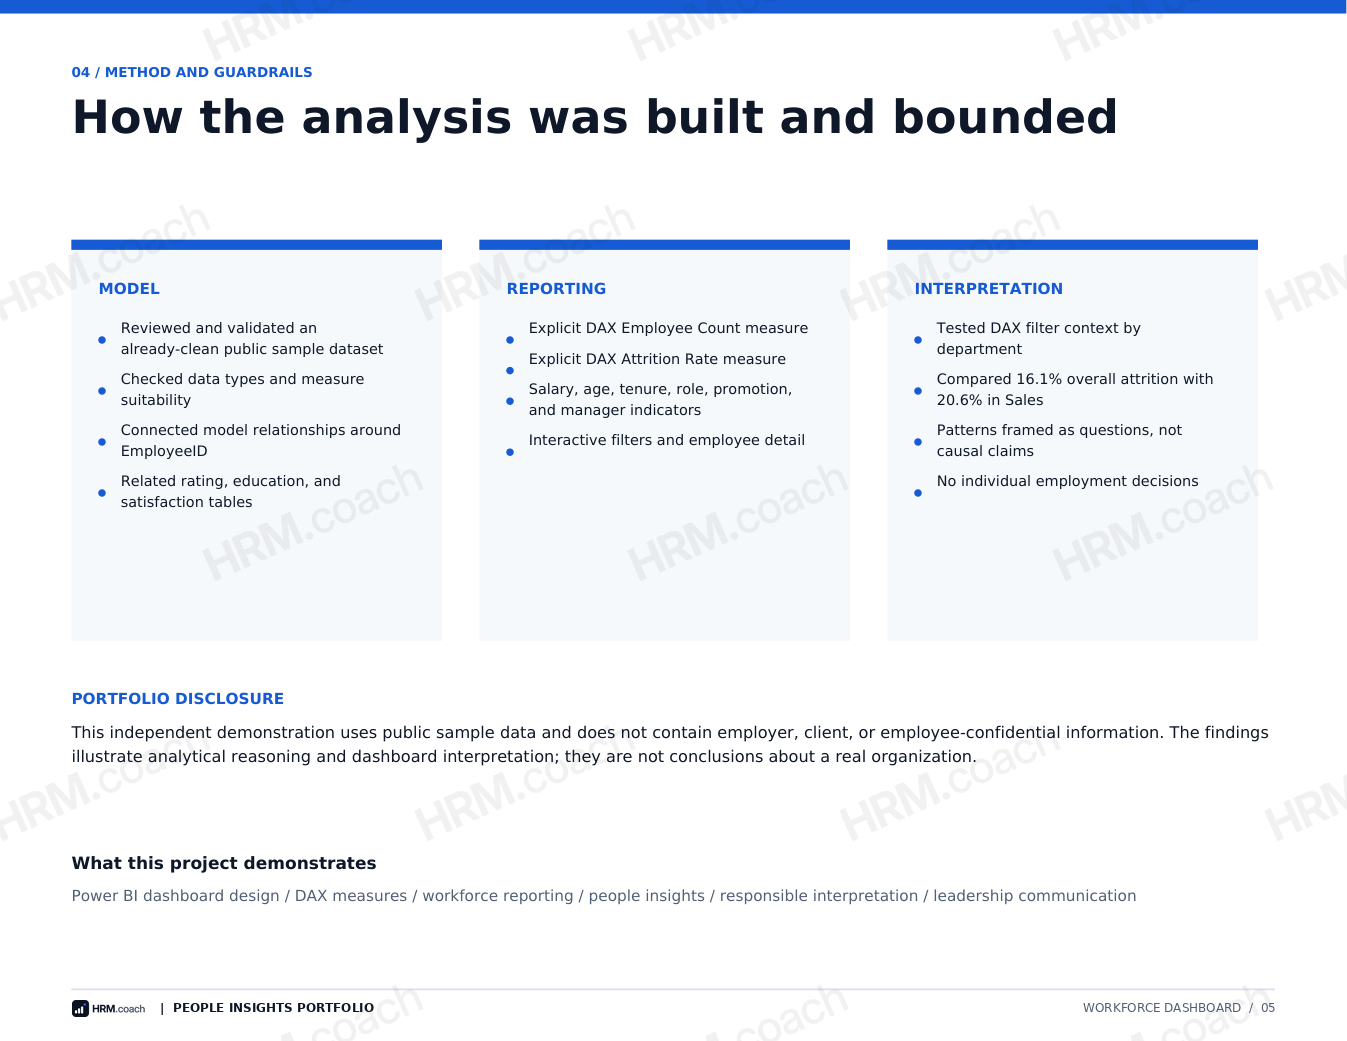
Workforce Metrics Dashboard
What do the core workforce measures show, and which questions should leaders ask next?
- Data
- Public sample dataset of 1,470 employees
- Method
- Data model, explicit DAX measures, filter-context testing
- Tools
- Power BI, DAX
- Result
- 20.6% Sales attrition vs 16.1% overall
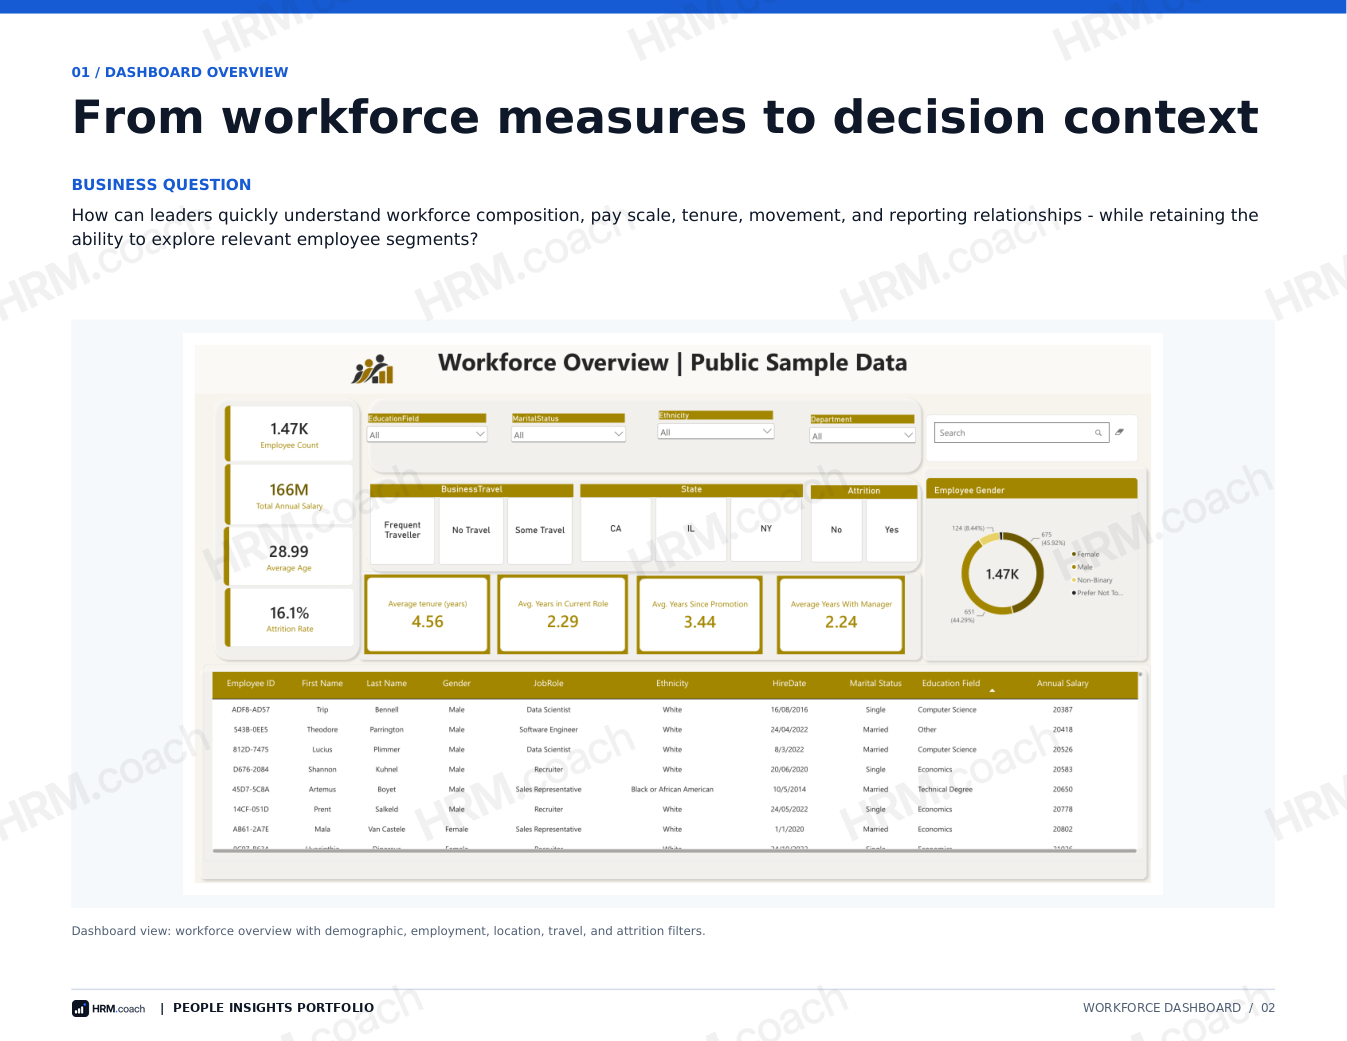
Power BI dashboard
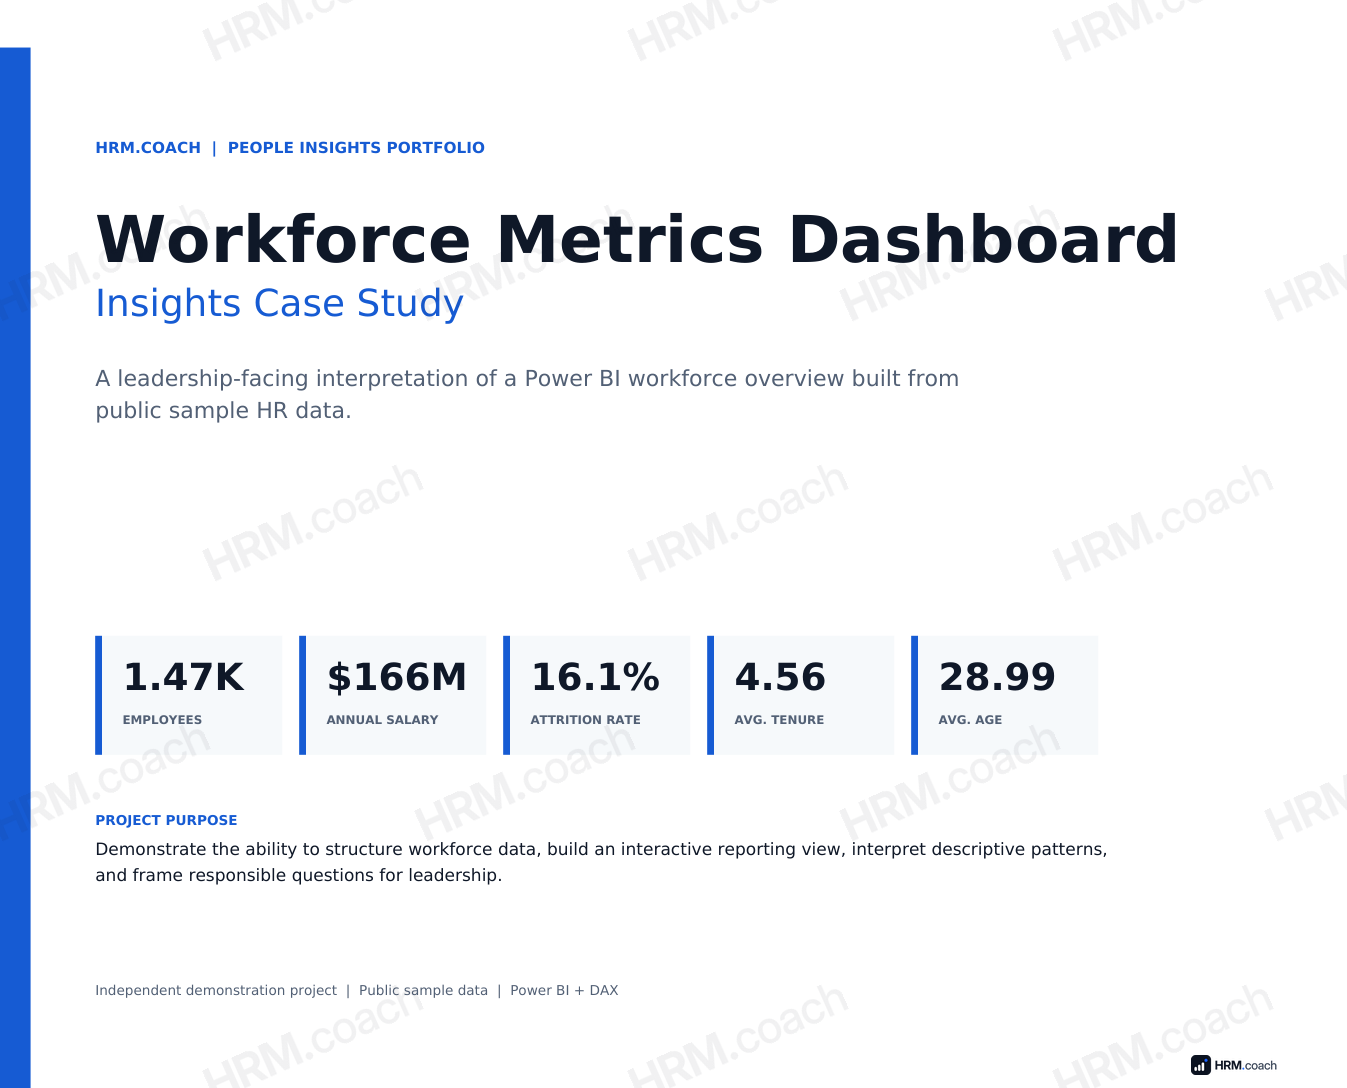
Insights case study
Case 03 · Data controls
Employee Data Quality Review
Does the review actually catch a problem when one is introduced?
- Data
- 20 fictional employee records
- Method
- Rule columns, a deliberate blank record, then a retest after correction
- Tools
- Excel, Power Query
- Result
- 20 / 20 records pass after a controlled retest
In this fictional 20-record exercise, I cleared Avery Grant’s source data while keeping the blank row in the table. The review flagged that row. I then restored the original values and refreshed the summary and exceptions.
The issue appeared in the exception output.
The corrected record cleared the tested checks.
Test and retest evidence
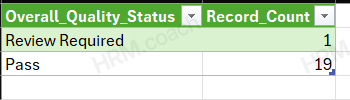


Screenshots are framed to show the results relevant to this data quality test.
What this control supports
HR can review the flagged records, assign corrections to the source-data owner, and rerun the checks before reporting. The rules account for pay basis: a blank hourly rate is expected for a salaried employee.
This is a controlled demonstration using fictional records. Passing means the records satisfy the configured rules. This retest covers the data quality queries only. No time savings or production outcomes were measured.
Case 04 · Workforce insight
New-Hire Onboarding and Retention
Where does the new-hire experience need stronger support?
- Data
- 300 fictional new hires, January 2024 to June 2025, each followed for a year
- Method
- Cohort comparison, survey analysis, an illustrative day-30 risk score
- Tools
- Power BI, DAX, Power Query
- Result
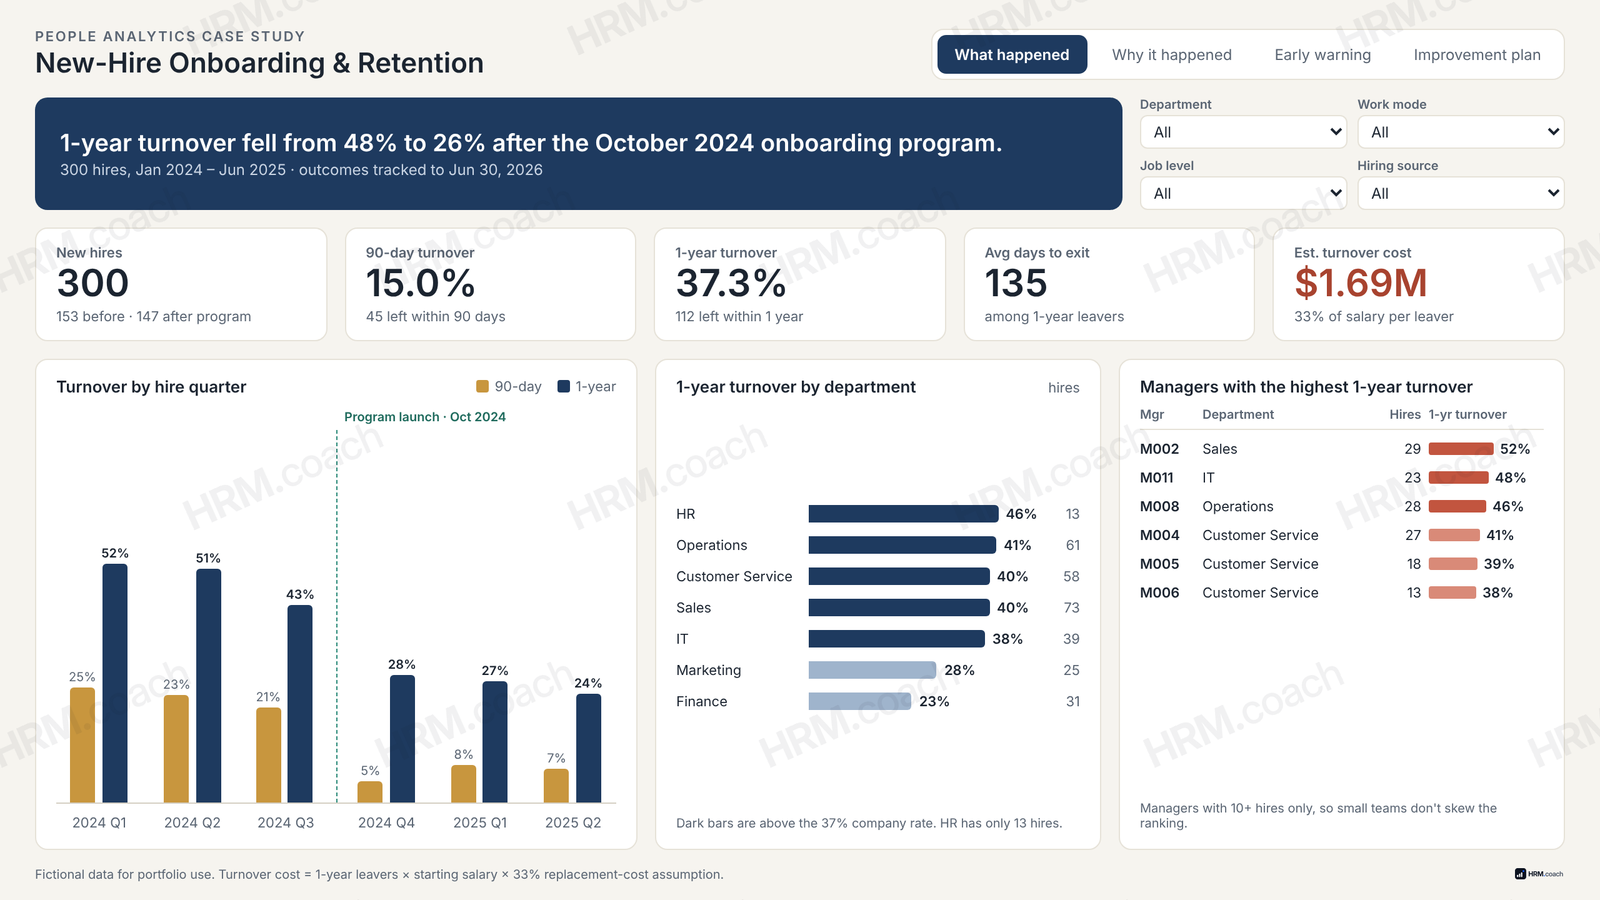
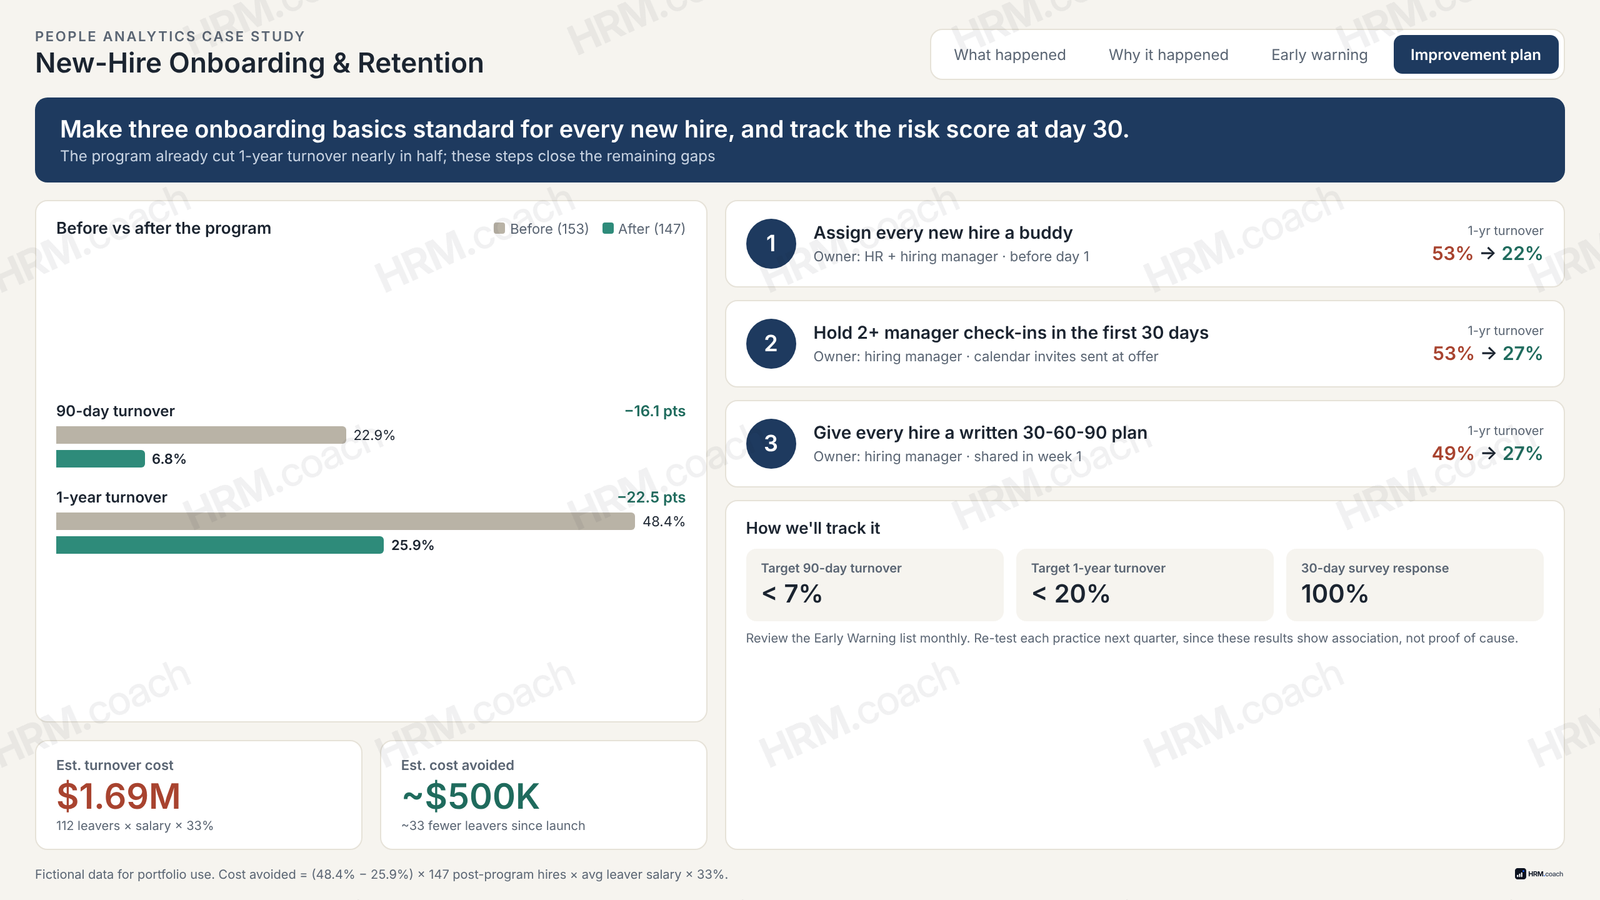
- 48% → 26% one-year turnover, before vs after
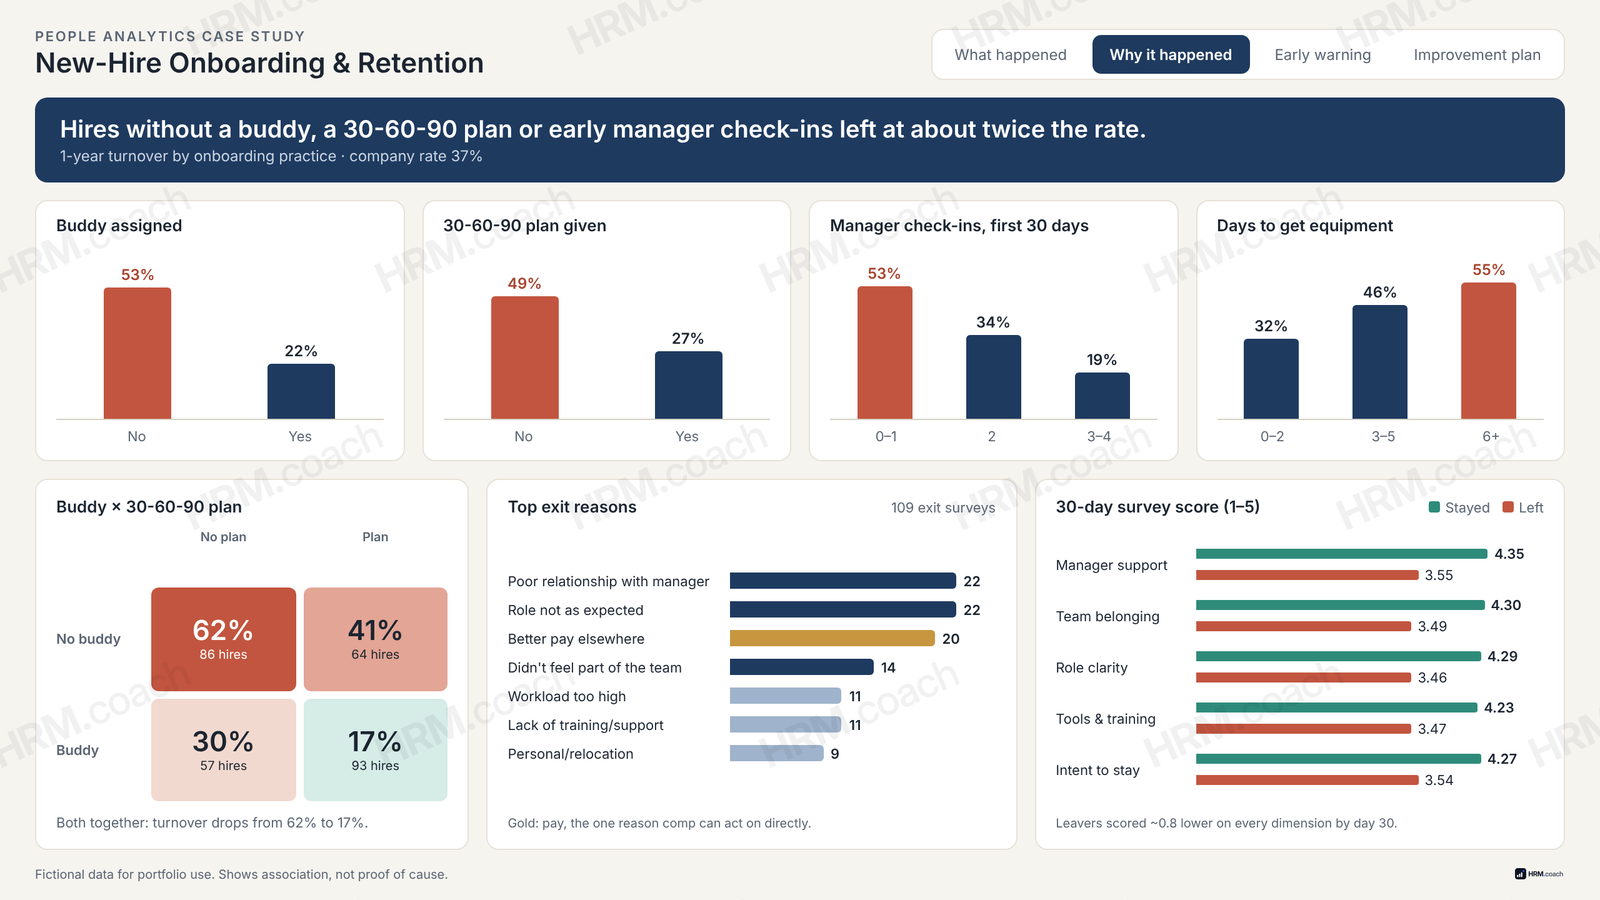
Early turnover raises a practical question for leaders: where does the new-hire experience need stronger support? This case study examines 300 fictional new hires to compare retention before and after an onboarding program, identify gaps in support, and recommend consistent practices for HR and hiring managers. Every hire had at least one year of follow-up.
The question
How did retention differ before and after the onboarding program, and which support gaps deserve closer attention?
What I found
- No buddy: 53% left within a year, vs 22% with one
- 0–1 manager check-ins in the first 30 days: 53% left, vs 19% with 3–4
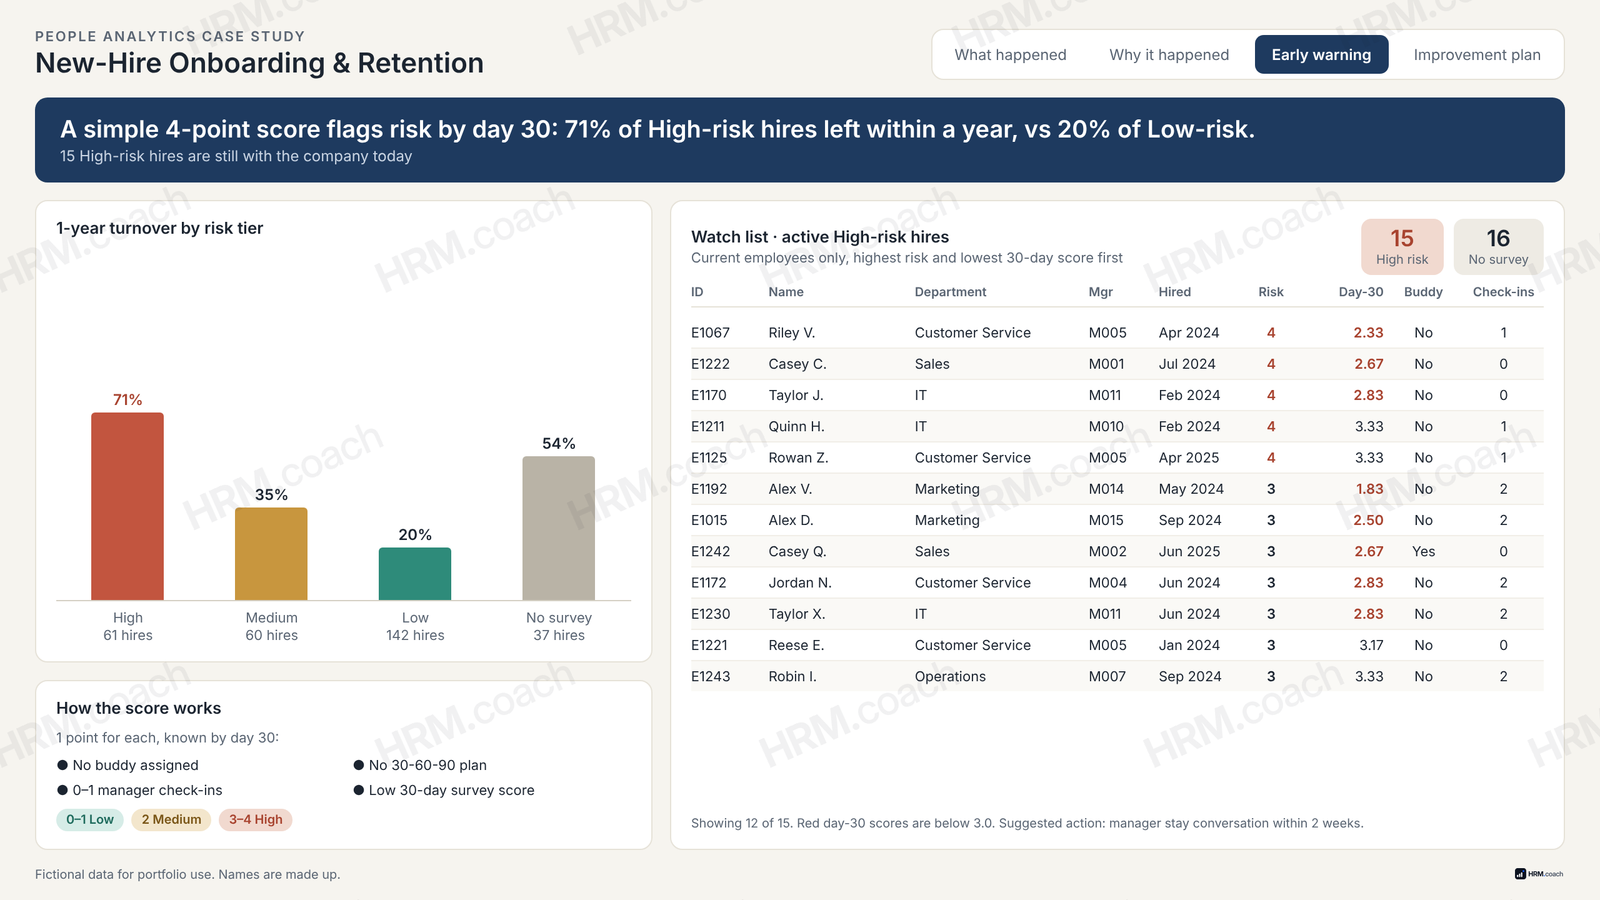
- Hires flagged High-risk at day 30: 71% left, vs 20% of Low-risk
What I recommended
- A buddy for every new hire
- 2+ manager check-ins in the first 30 days
- A written 30-60-90 plan in week one
The four dashboard pages
Tools & skills
- Power BI
- DAX measures
- Power Query
- Excel
- Data modeling
- Survey analysis
- Data storytelling
How progress would be assessed
Track onboarding completion, employee feedback, and turnover at 90 days and one year. Review results by department and manager to identify where implementation needs attention and whether improvements persist across later hiring groups.
All data is fictional and created for portfolio use. Hires span January 2024 through June 2025, with outcomes tracked through June 30, 2026. Results show association, not proof of cause. First-year turnover cost covers 112 departures and assumes 33% of starting salary per departure. The approximately $500,000 cost-avoidance figure shown in the dashboard is a comparison scenario, not verified savings. Targets are proposed goals.
Case 05 · Workforce insight
Workforce Attrition Analysis
Which teams are losing people fastest, how early do they leave, and why?
- Data
- 579 fictional employees, 254 exits and 1,491 ratings, 2018 to 2025
- Method
- CTEs, joins, window functions and date calculations
- Tools
- SQL
- Result
- 48.3% Customer Support attrition vs 20.1% overall
Completed project · Fictional demonstration data
A fictional growing company, 2018 to 2025: 579 employees across 8 departments, 254 exits with type and reason, and 1,491 annual performance ratings. The data is stored in SQLite and every figure below comes from SQL queries.
Attrition by department, 2025
Leavers divided by average headcount (start and end of year). Under each team: leavers of average headcount.
Needs actionAbove company rateBelow company rateCompany rate
Key findings
- Customer Support has a retention problem. It lost 29 people against an average headcount of 60 in 2025, an attrition rate of 48.3%. That is more than double the company rate of 20.1%, about double Sales (23.1%) and four times Engineering (11.7%).
- New hires are leaving early, and it is getting worse. 23.5% of 2023 hires left within their first year, rising to 27.1% of 2024 hires. Roughly one in four new starters is gone within twelve months.
- People leave for better opportunities and pay. “Better opportunity” and “Compensation” are the top two voluntary exit reasons in most departments. In Customer Support they account for about half of all voluntary exits (28.9% and 22.4%), with “Career growth” third (19.7%).
- Leavers were rated lower. People who left averaged 2.73 out of 5 in performance reviews, against 2.99 for current staff. Lower ratings may signal poor fit, or a lack of support and development before people go, so this is worth investigating before drawing conclusions.
Recommendations
- Benchmark Customer Support pay. With compensation and better offers driving exits, compare Support salaries with the market and consider a targeted adjustment or retention incentive.
- Build a visible career path in Support. Define progression steps (agent, senior agent, team lead) with clear criteria, so people can see a future without leaving.
- Strengthen the first year. Introduce structured onboarding, 30/60/90-day check-ins and a buddy system, and track first-year attrition each quarter.
- Use exit and stay interviews. Confirm the reasons behind the numbers and reach at-risk employees before they resign.
How the analysis works
- Calculate 2025 headcount at the start and end of the year for each department, then divide leavers by the average.
- Follow each 2023 and 2024 hiring group for twelve months to measure first-year attrition.
- Rank voluntary exit reasons within each department and show each reason’s share.
- Compare average performance ratings of leavers with current staff.
- Check the data for missing values and stray spaces before reporting.
Sample query: attrition rate by department, 2025
WITH people AS (
  SELECT employees.department_id, hire_date, termination_date
  FROM employees
  LEFT JOIN terminations ON terminations.employee_id = employees.employee_id
),
by_dept AS (
  SELECT department_id,
    SUM(CASE WHEN hire_date <  '2025-01-01' AND (termination_date IS NULL OR termination_date >= '2025-01-01')
             THEN 1 ELSE 0 END) AS hc_start,
    SUM(CASE WHEN hire_date <= '2025-12-31' AND (termination_date IS NULL OR termination_date >  '2025-12-31')
             THEN 1 ELSE 0 END) AS hc_end,
    SUM(CASE WHEN termination_date BETWEEN '2025-01-01' AND '2025-12-31' THEN 1 ELSE 0 END) AS leavers
  FROM people
  GROUP BY department_id
)
SELECT department_name,
       (hc_start + hc_end) / 2.0 AS avg_headcount,
       leavers,
       ROUND(100.0 * leavers / ((hc_start + hc_end) / 2.0), 1) AS attrition_pct
FROM by_dept
JOIN departments ON departments.department_id = by_dept.department_id
WHERE hc_start + hc_end > 0
ORDER BY attrition_pct DESC;
What this demonstrates
SQL joins (including LEFT and self joins), aggregation with GROUP BY and HAVING, CASE logic, subqueries, CTEs, window functions and date calculations, applied to core HR measures: headcount, attrition rate, first-year attrition and tenure.
Independent portfolio demonstration using fictional data. Ratings are compared across all reviews on record. Differences between groups are observed patterns, not proof of cause.
The HRM.coach framework
From trusted records to employee experience.
Each stage depends on the one before it. Insight is only as good as the records behind it.
- Stage 1
Fix the data
Reconciliation, deduction audits, exception checks, duplicates, missing records, and source-system inconsistencies.
Cases 01, 03
- Stage 2
Automate the reporting
Repeatable Power Query workflows, exception reports, workforce reporting, and leadership dashboards.
Cases 01, 02
- Stage 3
Diagnose workforce trends
Retention, performance, career growth, and manager support interpreted in context. Pay is examined when it helps explain an employee experience question.
Cases 02, 05
- Stage 4
Improve employee experience
Engagement, onboarding, manager effectiveness, employee trust, and evidence-informed recommendations.
Cases 04, 05
The approach
HR judgment first. Technology in service of the outcome.
- Understand the human and business need
Clarify the decision, audience, risk, and experience behind the request.
- Build the right HR control or approach
Apply sound HR practice, documentation standards, and operational context.
- Make the work repeatable
Use reporting and automation where they improve accuracy, speed, and consistency.
- Communicate what leaders need to know
Translate activity into outcomes, implications, ownership, and next action.
Tools
Tools behind the work.
Each case study names the tools it used and the limits of the analysis.
| Tool | Used for | Cases |
|---|---|---|
| Excel | Record review, rule columns, controlled tests | 01, 03 |
| Power Query | Joining exports, reconciliation and data quality rules, refreshable outputs | 01, 03 |
| Power BI and DAX | Data models, explicit measures, filter-context testing, dashboards | 02, 04 |
| SQL | Headcount, attrition, first-year exits and exit reasons with CTEs, joins and window functions | 05 |
| Power Automate, SharePoint, VBA | Workflow and reporting automation in day-to-day HR operations | – |
| HRIS and payroll exports | Authorized XLS, XLSX or CSV extracts as the starting point for analysis | 01 |
Connect